
Resources
Baseball Pitching Chart
A pitching chart records every pitch a pitcher throws: the pitch type, the intended location, where it actually went, and the result. This free chart comes two ways: a printable PDF with a game chart and a bullpen chart on separate pages, and an Excel version that totals strike percentage, first-pitch strikes, and command by pitch type as you type. No email, no account.

Download the Pitching Chart
PDFDownload the printable PDF
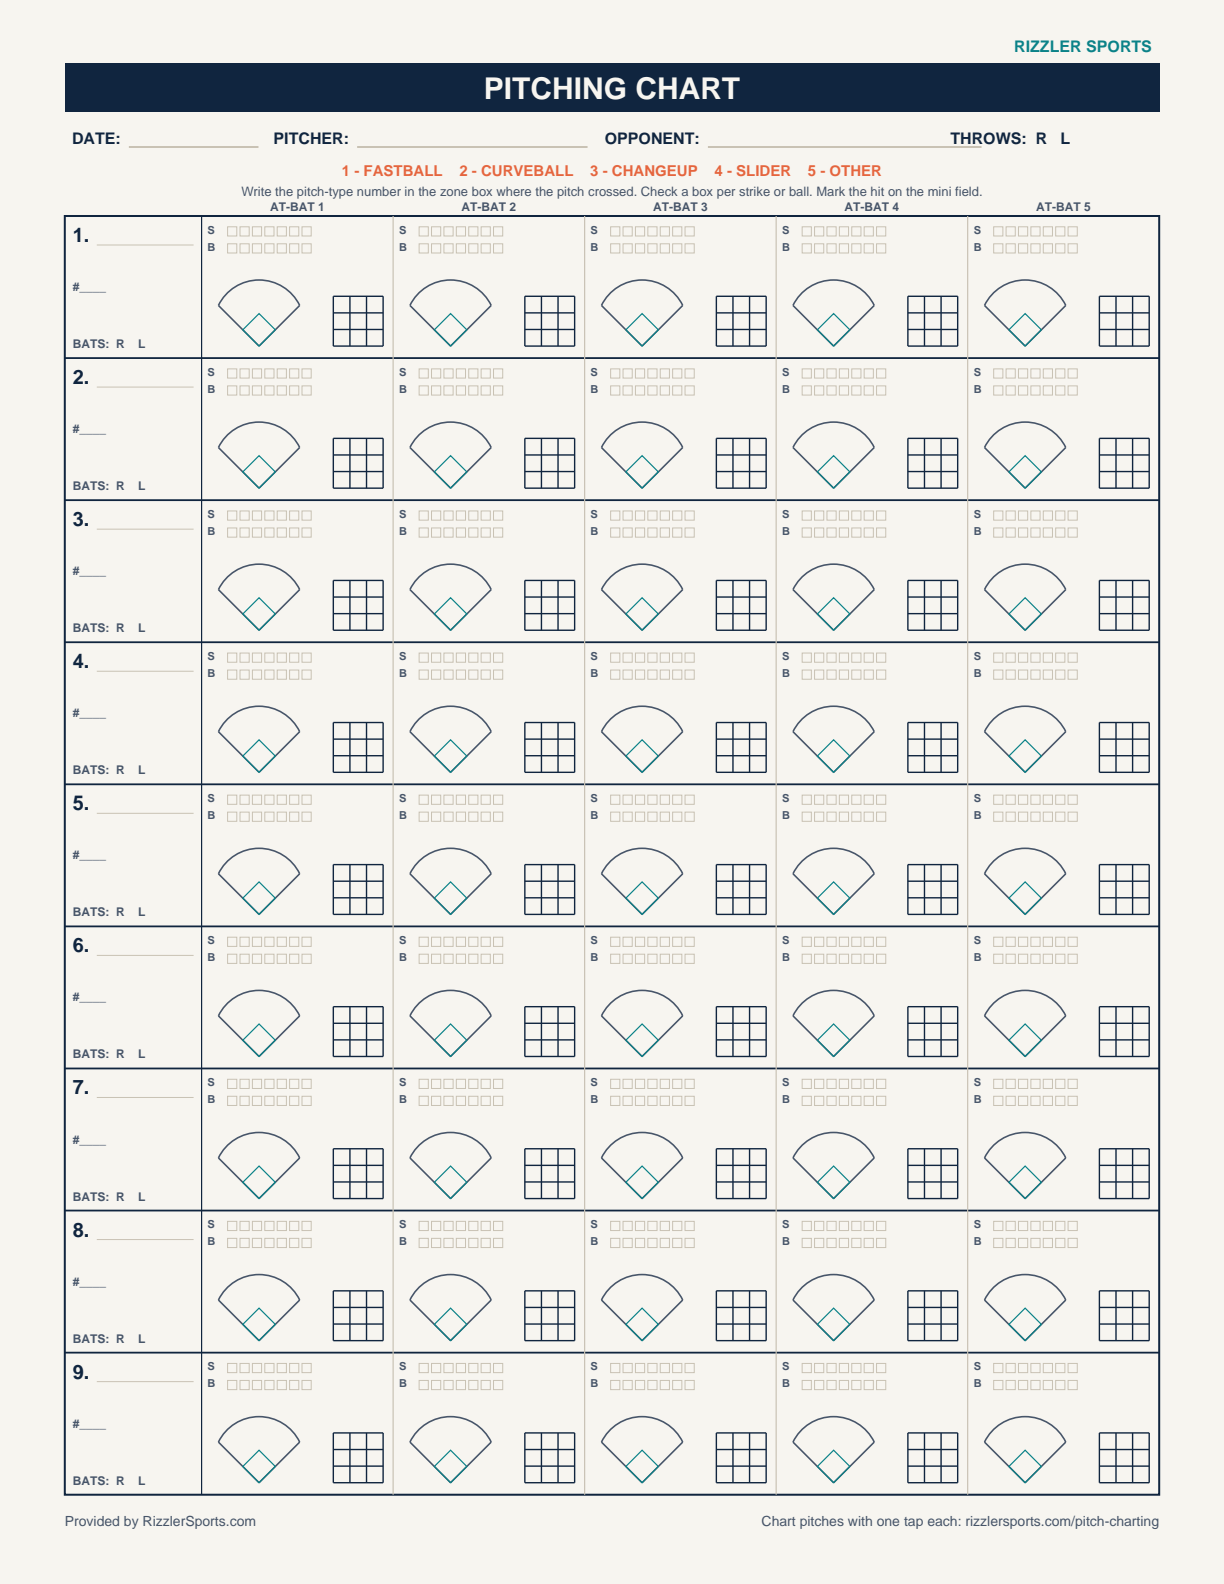
Three chart pages: a game pitching chart (one cell per pitch, seven at-bat columns of 15 cells per page), a lineup-grid chart (nine batters by five at-bats, each with a mini spray field, strike and ball tallies, and a zone box for the pitch-type number), and a bullpen chart (40 pitches with a command target column and session notes).
ExcelDownload the auto-totaling Excel version
Log pitch type, location, and result per pitch; the sheet totals pitches, strike percentage, first-pitch strike percentage, and command rate by pitch type, and it includes a filled example game so you can see a completed chart before your first one.
What a Pitching Chart Tracks
Four things per pitch, and the fourth is the one most paper charts skip:
- Pitch type: fastball, changeup, curveball, whatever your pitcher actually throws
- Called location: where you wanted it
- Actual location: where it went
- Result: ball, called strike, swinging strike, foul, in play
Logging called location next to actual location is what turns a tally sheet into a development tool, because command is the difference between the two, not the strike percentage alone. A pitcher can throw 65 percent strikes and still miss his spot on every one of them.
The chart groups pitches by batter so you can also read sequencing after the game: what you called on 0-2, what got hit, and whether the second time through the order looked different from the first.
How to Chart a Game
Write the pitcher's name and the date, then log one cell per pitch, with batters across the top so each column is one at-bat. In the cell, write the pitch type, the called and actual zones, and the result (FB 5/8 K reads: fastball, called middle, missed low, called strike). Use the abbreviations printed on the sheet (FB fastball, CH changeup, CB curveball, SL slider, OT other) and the nine-zone grid for location: the strike zone as a 3x3 grid numbered 1 through 9, with B for a ball well out of the zone. Innings read left to right and you can reconstruct any at-bat from its column.
One job, one person. Charting every pitch while also coaching third does not work above coach pitch. Give the chart to a bench coach or a reliable parent, the same way you would assign the pitch count sheet. If the same person keeps both, the pitching chart already contains the count; the pitch count sheet adds the rest-day math that keeps you legal under Little League's pitch count rules.
Game Chart vs Bullpen Chart
The game chart records what happened under consequences; the bullpen chart records deliberate practice, so its columns differ. In a bullpen you set the target before each pitch, so the bullpen page has a command column scored hit or miss against the called spot, plus a session plan line (for example, 25 pitches: 10 fastballs both sides, 8 changeups, 7 curveballs) and a notes row for mechanical cues. Ten charted bullpens tell you more about a young pitcher's development than ten charted games, because the game sample is noisy and the bullpen sample is controlled.
Reading the Chart After the Game
Start with three numbers, in this order: strike percentage (60 percent is a solid youth benchmark), first-pitch strike percentage (one of the most reliable predictors of a good inning at every level), and command rate by pitch type (actual location matching called location). Then look at the misses as a pattern, not a number. Arm-side and low is a normal miss; glove-side and up usually means a mechanical problem worth a bullpen. If the changeup's command rate is 30 points below the fastball's, that pitch is not ready for a 2-1 count, and now you have the chart to show the pitcher why. The pitching stats guide explains the full set of numbers you can build from charted pitches.
Pitching Charts by Age
Ages 9-12 (Little League, 9u-12u). Keep it light: pitch count, strikes and balls, and first-pitch strikes. Pitchers this age should be living on a fastball and a changeup, so a full type-and-location chart is more clipboard than the game deserves. The chart's totals row works fine on its own.
Ages 13-15 (13u, 14u, middle school, JV). This is where full charting starts earning its ink. Pitchers add a breaking ball, the field grows through 50/70 toward 60/90, and command by pitch type becomes the development conversation. Chart called versus actual location on every pitch.
High school varsity and 16u-18u travel. Chart everything, including sequencing. At this level the chart doubles as scouting: your own staff's tendencies are the other team's spray chart. Varsity staffs typically add the radar reading column and track velocity by pitch type across starts, and the bullpen page becomes a weekly routine between starts rather than an occasional extra.
Frequently Asked Questions
Is the pitching chart free?
Yes. Both files download directly with no email or account.
What is the difference between a pitching chart and a pitch count sheet?
A pitch count sheet tracks how many pitches each pitcher threw, for rest-day and eligibility rules. A pitching chart tracks what each pitch was and where it went, for development. They pair well, and the Excel version of this chart totals the count automatically; for the rest-day math, use the pitch count tracking sheet.
Does the chart work for softball?
The layout works, but softball pitch types and zones differ enough that we built a separate softball pitching chart with windmill pitch types on the sheet.
How many pitches fit on one page?
One game-chart page holds seven at-bat columns of 15 pitch cells (105 pitches of capacity, but the real limit is the seven at-bats). A youth game runs 25 to 30 at-bats, so print three or four game pages and start a fresh column for each batter. The lineup-grid page covers nine batters times five at-bats on a single sheet, the right view when you are charting against a lineup rather than developing your own pitcher. The bullpen chart holds a 40-pitch session on one page.
Can I chart pitches on my phone instead?
Yes. Rizzler's pitch charting does this exact job on iPhone and iPad with one tap per pitch, and it builds the heatmaps, strike percentages, and command analytics automatically across the whole season. Pitch charting comes with the paid Coach and Club plans; per-game pitch counts are free on every plan.
Want every charted pitch to build heatmaps and season analytics on its own?
Read Next
Tryout Evaluation Form: Printable Template for Any Sport
ResourcesSoftball Age Chart 2026: USSSA, USA, PGF & Alliance Cutoffs
Rules10U Baseball Practice Plan: A 75-Minute Kid-Pitch Practice
LearnPitching Stats: Every Mound Stat Explained for Coaches
StatsVolleyball Practice Plan Template: Printable Session Sheet and Weekly Grid
VolleyballPlaying Time Tracking: Fair Rotation, Backed by Data
Features