
Resources
Softball Pitching Chart
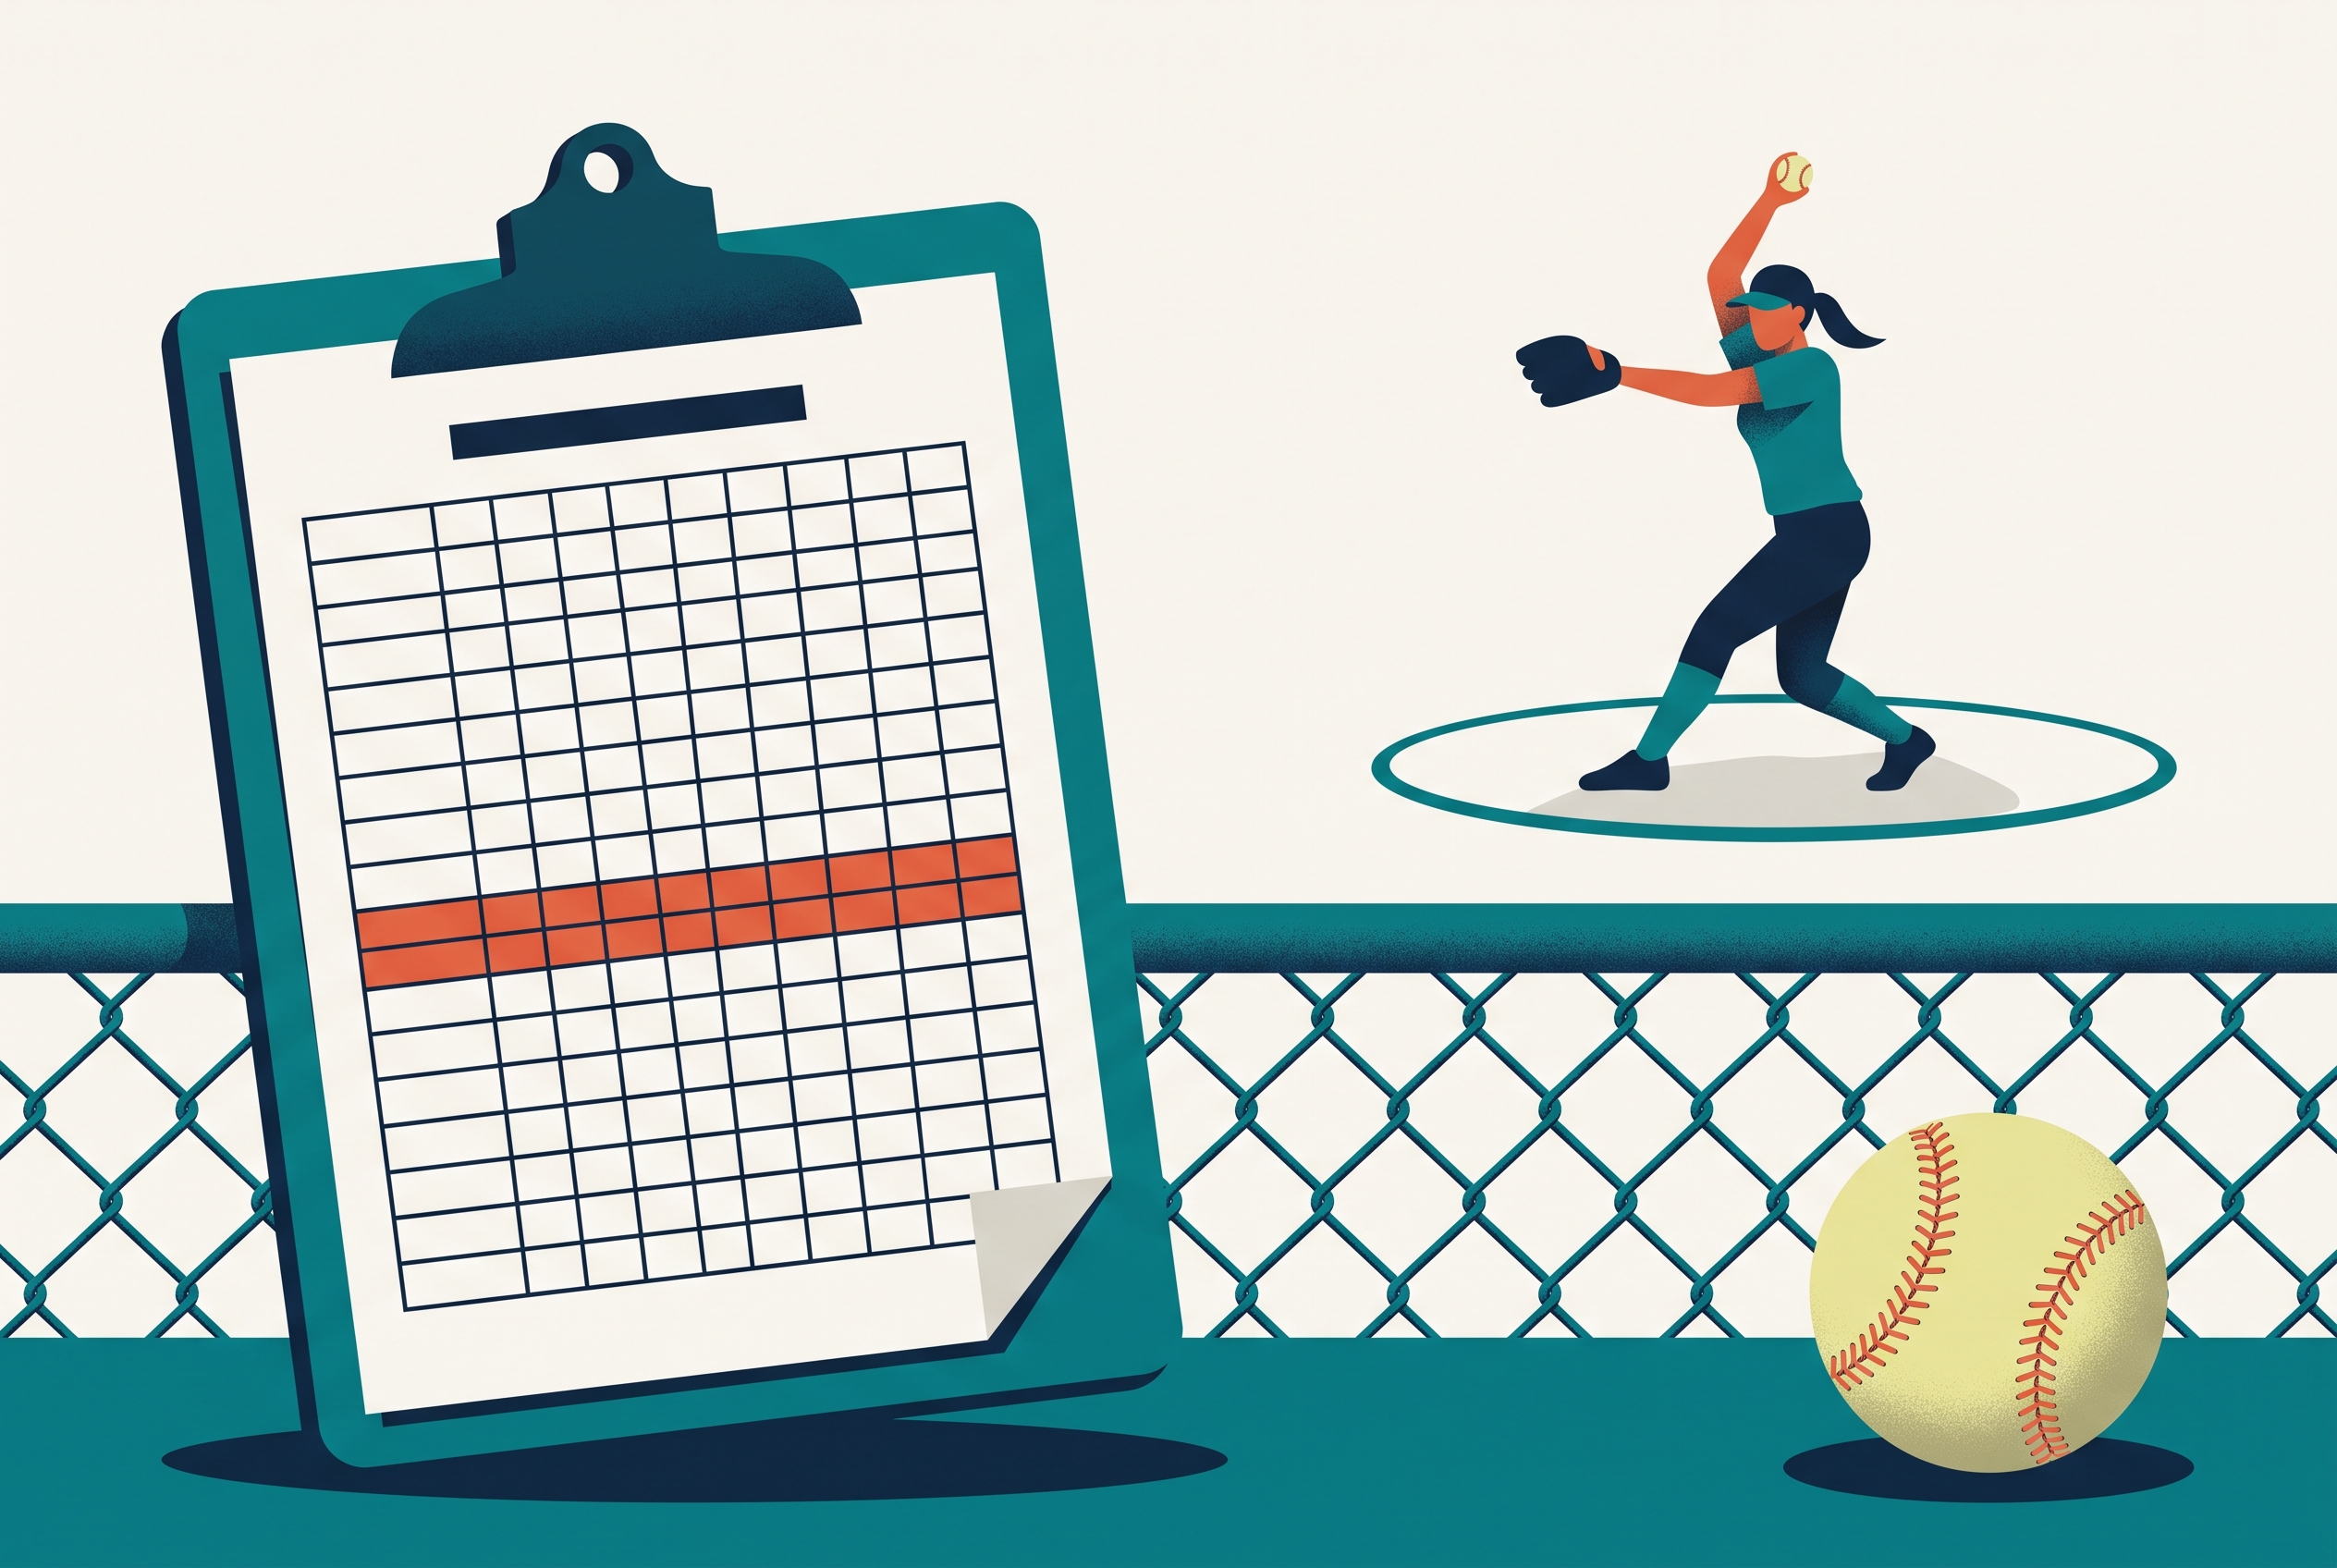
A softball pitching chart records every pitch of a fastpitch outing: the pitch type, the called location, where it actually crossed the zone, and the result. This free chart is built for the windmill arsenal, with drop, rise, screw, curve, and change on the sheet alongside the fastball. It comes as a printable PDF with a game chart and a bullpen chart, and an Excel version that totals strike percentage, first-pitch strikes, and command by pitch as you type. No email required.
Download the Pitching Chart
PDFDownload the printable PDF
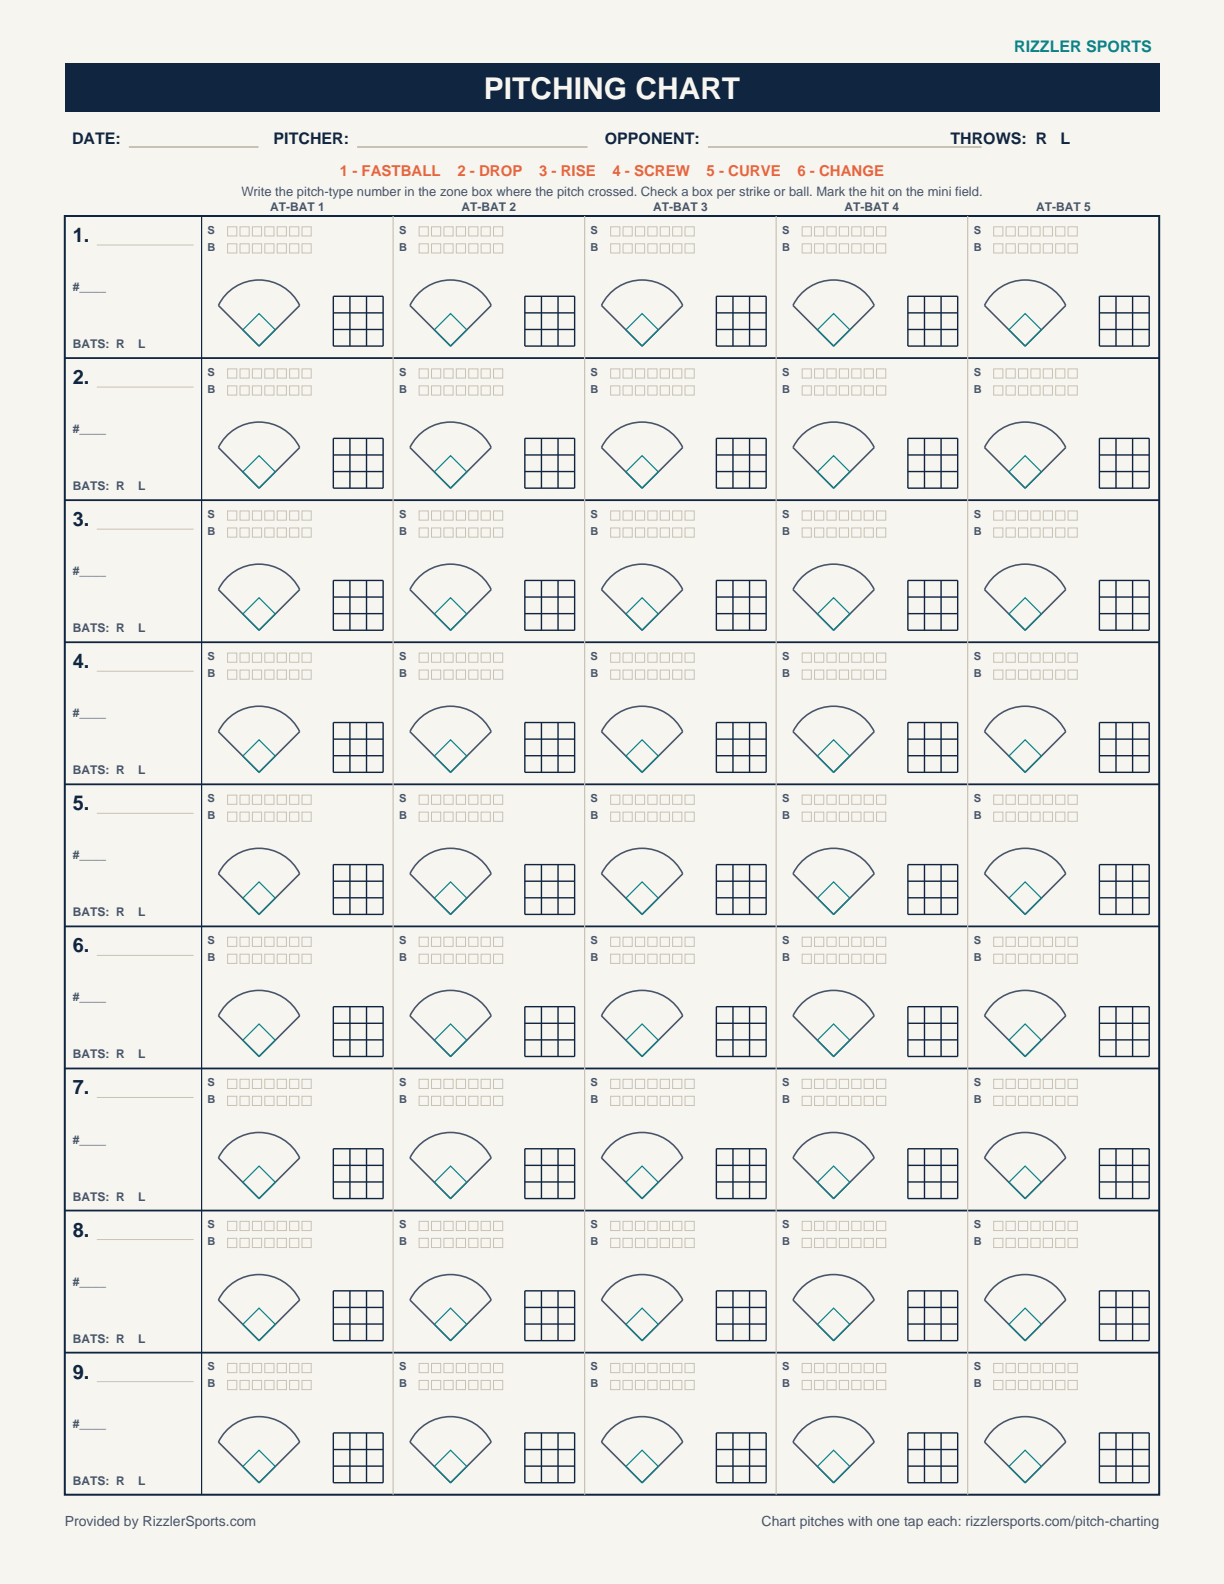
Three chart pages: a game pitching chart with fastpitch pitch types (FB, DR drop, RI rise, SC screw, CU curve, CH change), a lineup-grid chart (nine batters by five at-bats, each with a mini spray field, tallies, and a zone box for the pitch-type number), and a bullpen chart with a command target column and session notes.
ExcelDownload the auto-totaling Excel version
Log each pitch and the sheet totals pitches, strike percentage, first-pitch strikes, and command rate by pitch type, with a filled example game included so you can see a completed fastpitch chart first.
What a Softball Pitching Chart Tracks
Four entries per pitch: the pitch type, the location you called, the location it actually crossed, and the result. The called-versus-actual pair is the whole point. Fastpitch movement pitches live or die on location, and a rise ball that stays belt-high is not a rise ball, it is batting practice. Charting where the pitch was supposed to go next to where it went is how you find that out on paper instead of off the opponent's bat.
The chart groups pitches by batter so sequencing survives the game: what she threw on 0-2, which pitch got squared up, and whether the lineup adjusted the second time through.
How to Chart a Fastpitch Game
One cell per pitch, with batters across the top so each column is one at-bat. In the cell, write the pitch type, the called and actual zones, and the result, using the abbreviations on the sheet: FB fastball, DR drop, RI rise, SC screwball, CU curveball, CH changeup. Location uses a nine-zone grid, the strike zone as a 3x3 grid numbered 1 through 9, with B for a clear ball; for drop and rise balls, chart where the pitch crossed the plate, not where the catcher caught it, since late vertical movement is exactly what you are trying to measure.
Hand the chart to a bench coach or a steady parent rather than keeping it yourself. Charting is a full job, and in softball there is no pitch-limit recorder to double with: unlike baseball, fastpitch has no mandated pitch counts, so the chart is purely a development document.
Game Chart vs Bullpen Chart
The bullpen page is where young windmill pitchers actually improve, so its columns are built for deliberate work: a called target set before every pitch, a hit-or-miss command score against that target, a session plan line (for example, 30 pitches: 10 fastballs both corners, 10 drops, 5 changes, 5 rises), and a notes row for cues like a consistent release point or a finished snap. Spin work earns a bullpen column note rather than a game stat: you can see a flat curve on the chart as a command miss pattern long before you can measure spin.
Reading the Chart After the Game
Read three numbers first: strike percentage (around 60 percent is a solid fastpitch benchmark), first-pitch strike percentage (the at-bat tilts hard on it at every level), and command rate by pitch type. Then read the pattern of the misses. A drop ball missing up is a pitch not finishing; a change missing badly off-plate usually means the grip is slipping under game nerves even when it worked Tuesday. If the change's command rate runs far below the fastball's, it is not ready for a full count, and the chart settles that conversation without a lecture. The pitching stats guide covers the numbers you can build from a charted game.
Pitching Charts by Age
Ages 9-12 (10u, 12u). Chart lightly: strikes, balls, and first-pitch strikes. Most 10u pitchers are establishing one consistent fastball and a change; a full type grid adds clipboard work the game does not need yet. At 12u, start charting the change as its own pitch.
Ages 13-15 (14u, middle school, JV). Full charting earns its place here. The second and third movement pitches arrive, and called-versus-actual location becomes the development conversation of the week. Chart every pitch of every outing, and run the bullpen page weekly.
High school varsity and 16u-18u travel. Chart everything including sequencing, because at this level your chart is also the scouting report the next opponent is building on your ace. Varsity and 18u staffs add the speed column, tracking the gap between fastball and change (10 miles per hour or more is a common working target) across starts rather than within one.
Does softball have pitch count limits?
No national body mandates fastpitch pitch limits the way Little League baseball does. Treat that as a rulebook fact, not a safety verdict: windmill pitchers still rack up overuse injuries, and sports-medicine researchers recommend managing workload even though no rule requires it. It is not a license for 140-pitch Saturdays. Track workload across tournament weekends on the chart's totals row, and treat a velocity drop or a command collapse late in an outing as the fatigue signal the rulebook does not provide.
Frequently Asked Questions
Is the softball pitching chart free?
Yes. Both files download directly, no email or account.
How is this different from the baseball pitching chart?
The sheet carries windmill pitch types (drop, rise, screw, curve, change) instead of baseball's, the reading guidance is fastpitch-specific, and there is no rest-day framing since softball has no mandated pitch limits. The baseball version has its own pair of files.
What ages is the chart for?
The printable works from 10u through varsity. The by-age section above covers how much of it to use at each level; the short version is tally at 10u, full chart from 13u-14u up.
Does slowpitch need a pitching chart?
No. Charting is a fastpitch tool; slowpitch pitching has no called locations or movement arsenal worth logging per pitch.
Can I chart pitches on my phone instead?
Yes. Rizzler's pitch charting runs this job on iPhone and iPad with one tap per pitch, works for softball exactly as it does for baseball, and builds each pitcher's heatmap and command analytics across the season automatically. It comes with the paid Coach and Club plans.
Want every charted pitch to build your pitcher's season analytics on its own?
Read Next
Best Baseball Tryout Management Tools in 2026
LearnAI Stats Analysis: Turn Game Data into Coaching Insights
FeaturesFielding Stats: Defensive Numbers Explained for Coaches
StatsHow to Run a Football Tryout: A Coach's Step-by-Step Guide
Learn5-1 Serve Receive: All 6 Rotations, Diagrammed
VolleyballUSSSA Age Chart 2026: Baseball & Fastpitch Cutoffs
Rules