
Learn
Baseball Spray Chart
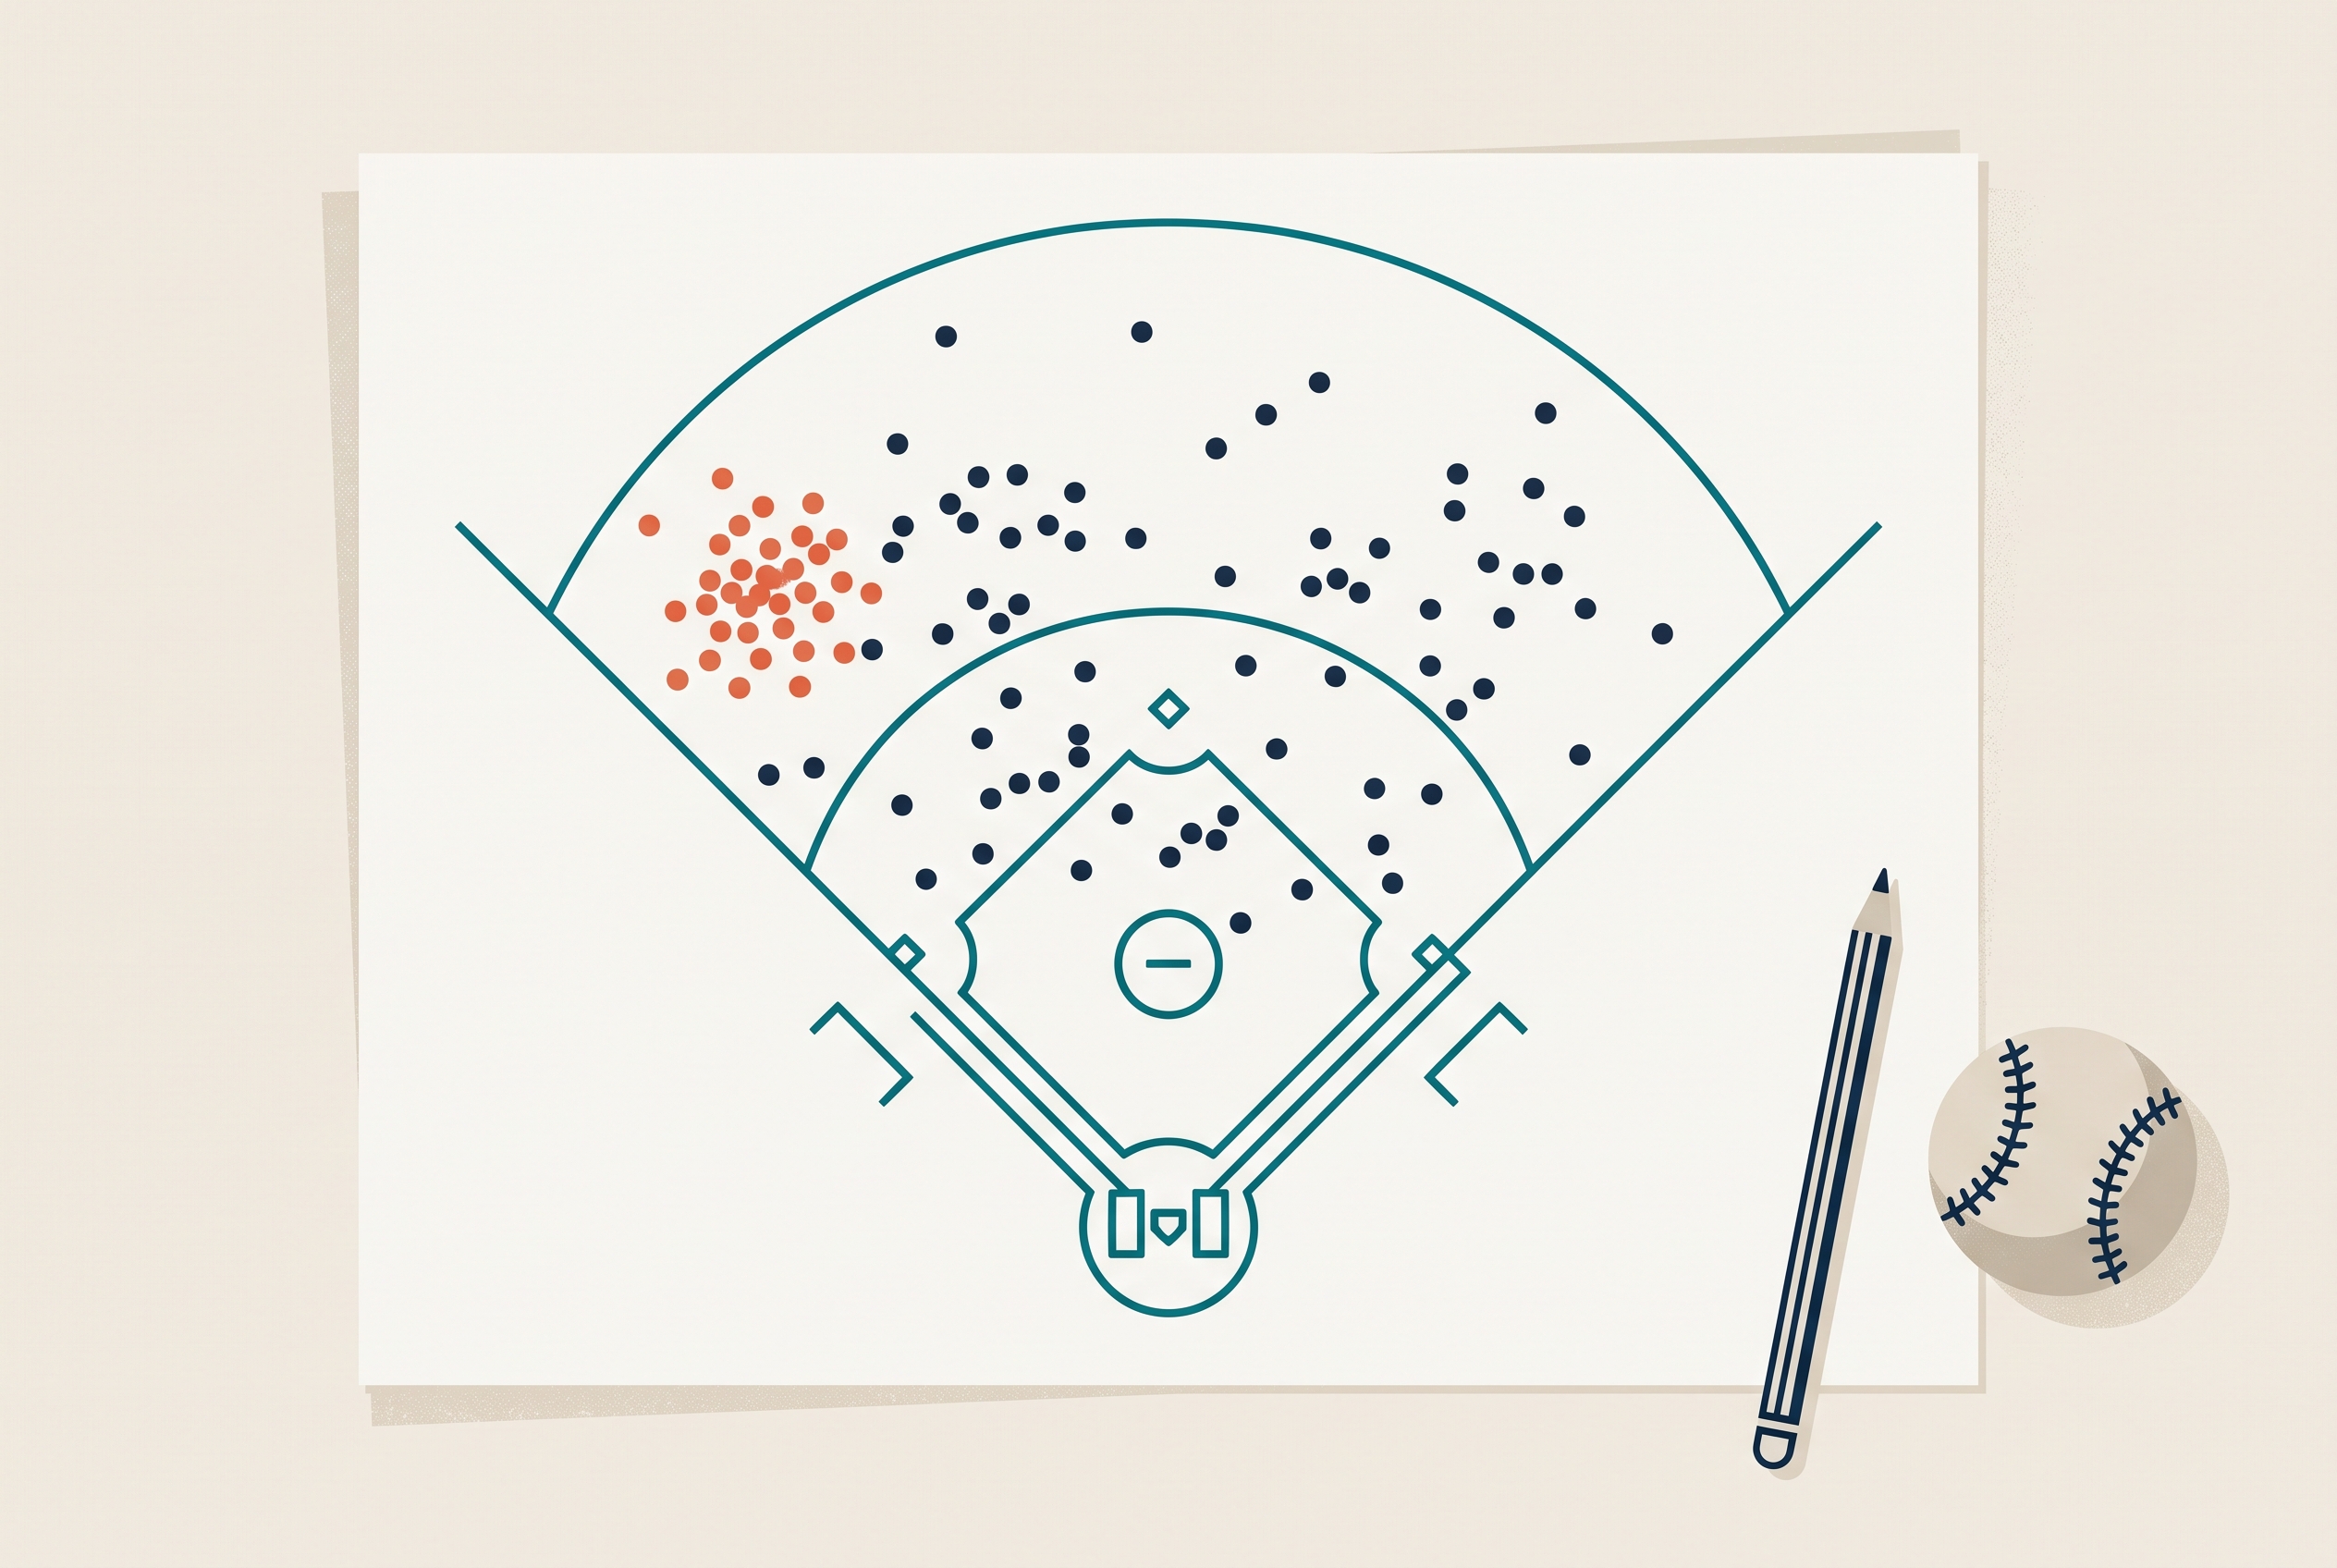
A spray chart is a diagram of the field that maps where a hitter's batted balls land. Each dot is one ball in play, usually coded by hit type (ground ball, line drive, fly ball) and outcome, and the picture that emerges after a few games shows a hitter's tendencies at a glance: pull-heavy, up the middle, or spraying to all fields. Coaches use spray charts to position defenses and to have honest development conversations with hitters. This page explains how to read one, how to chart one by hand, and where the digital version takes over. The free printable chart pad and Excel hit log are in the download section below, no email required.
How to Read a Spray Chart
Read it in three passes: direction, then depth, then hit type.
- Direction. Divide the field into left, center, and right, and see where the dots cluster. A right-handed hitter with most contact in left field is a pull hitter; dots spread evenly mean an all-fields approach.
- Depth. Dots bunched shallow usually mean contact without drive; dots at the warning track in one sector mean real power to that side.
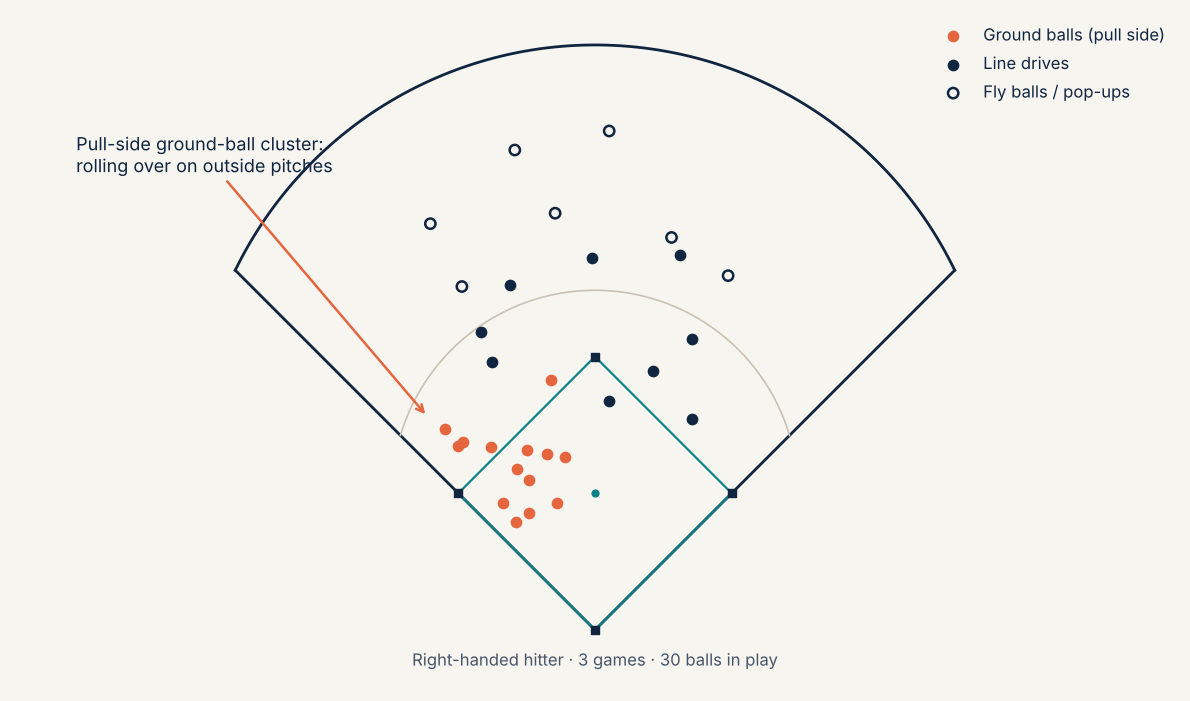
- Hit type. If the chart codes ground balls versus line drives versus fly balls, the story sharpens. A pull-side cluster of ground balls usually means a hitter rolling over, often on pitches away or off-speed out front; a pull-side cluster of line drives is a strength to build an approach around.
Two cautions for youth charts. Sample size matters: five games of dots is a sketch, not a profile, so resist repositioning your whole defense off one weekend. And at younger ages, where the ball goes is mostly where the ball was pitched; tendencies firm up as swings mature.
How Coaches Use Spray Charts
Defensively, the chart is a positioning tool from about 13u up. If the opposing cleanup hitter's chart is 80 percent pull-side, your left fielder and shortstop shade before the first pitch instead of after the second double. High school and travel staffs chart opponents for exactly this reason, and it is the same logic big-league infield shifts ran on before the rule changes (outfield shading was never restricted and is still everywhere).
Offensively, the chart is a mirror. Hitters remember their three hardest-hit balls; the chart remembers all of them. A player who believes he drives the ball to all fields and then sees forty dots stacked on the pull side has just had a more productive hitting conversation than any lecture provides. Pair the chart with the batting stats that quantify it, like average and hard-contact rate, and the next week of cage work has a target instead of a vibe.
How to Chart Hits by Hand
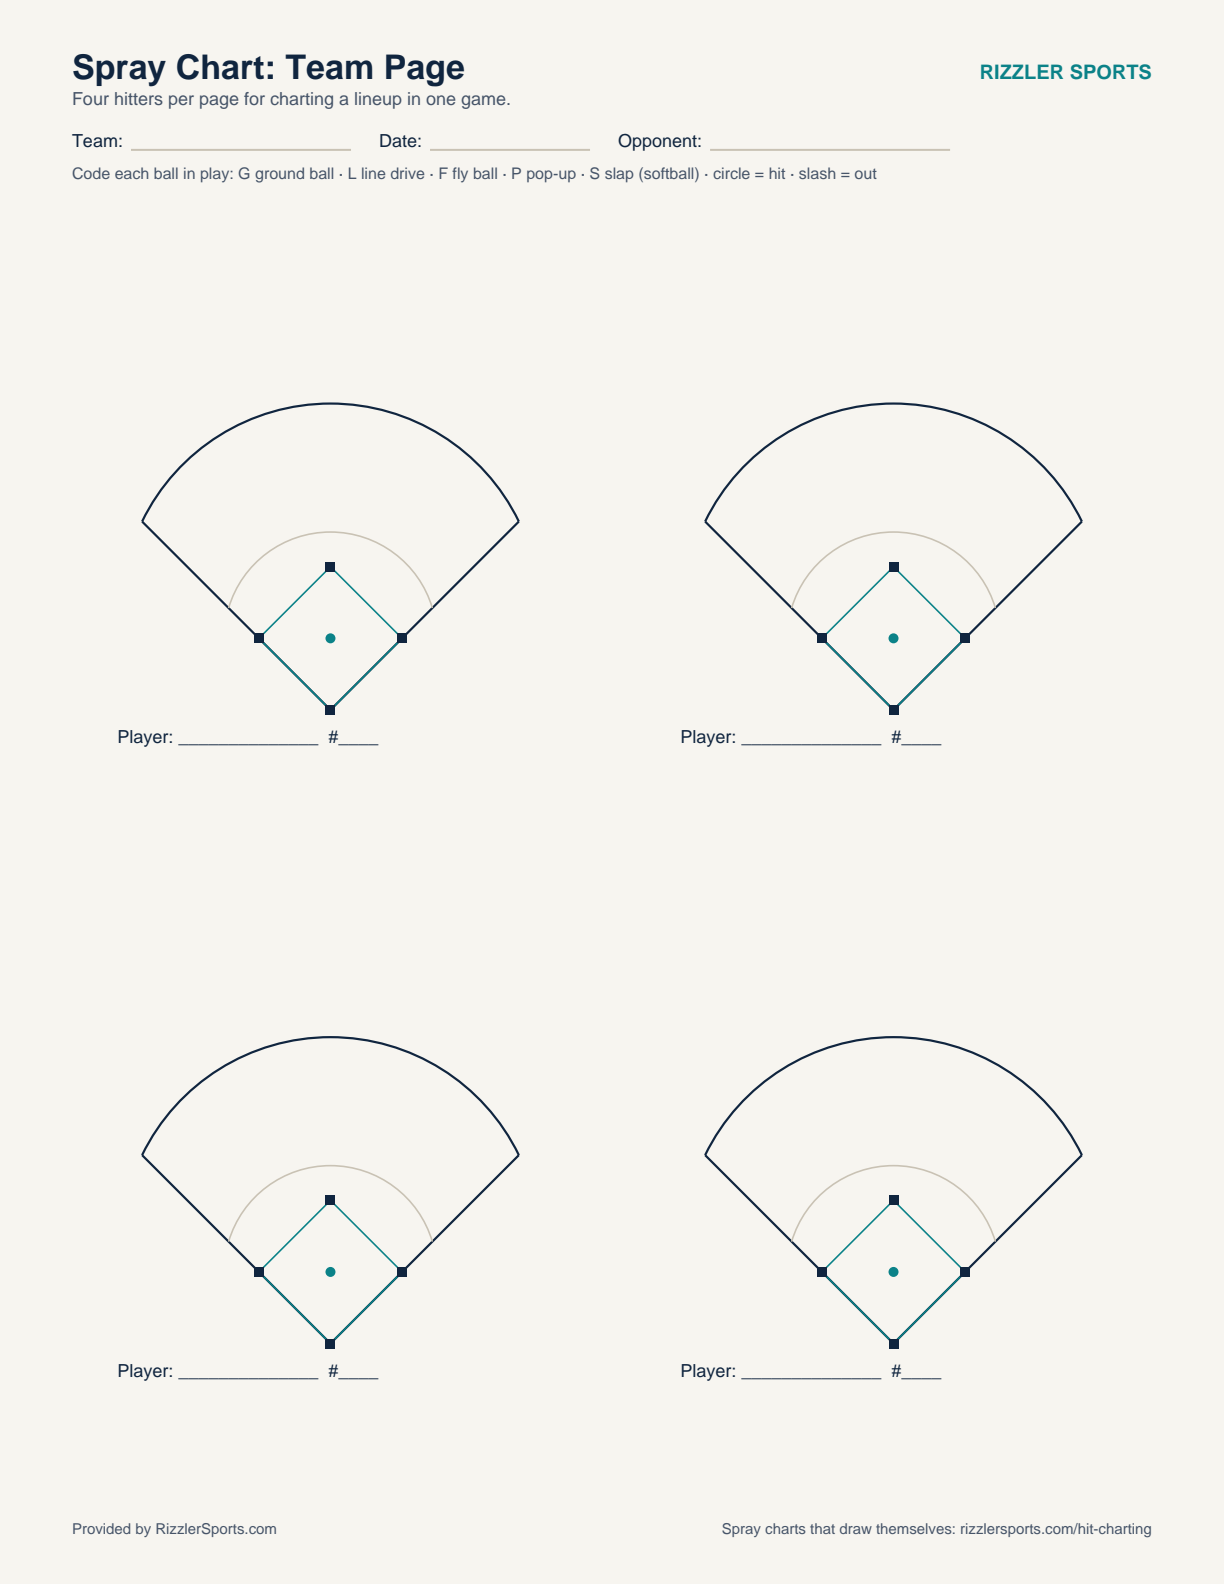
You need a field diagram pad and a code. For each ball in play, mark a dot where it landed (or was fielded, for ground balls), then code it: G ground ball, L line drive, F fly ball, P pop-up. Circle the dot for a hit, slash it for an out. Add the batter's number next to the dot if you are charting a whole lineup on one page, or use one page per hitter across several games, which is the version that reveals tendencies.
PDFDownload the printable spray chart PDF
A field-diagram chart pad: a full-page single-hitter chart (one page per player, multiple games of dots), a 4-up team page for charting a lineup in one game, and the hit-type legend printed on every page. Works for baseball and softball fields.
ExcelDownload the Excel hit log
A hit log that turns rows into a chart: log batter, hit type, and field sector per ball in play, and the sheet totals each hitter's pull, center, and opposite-field rates and hit-type mix, with a filled example tab included.
Like pitching charts, spray charting is one person's job. A parent in the stands with the pad does this well, and the same division of labor applies if your bench is also keeping a pitching chart on your own staff.
Spray Charts for Softball
Everything above applies to fastpitch, with the sectors adjusted for the 200-foot fence and the slap game. For softball charts, add one code: S for a slap, charted separately from full swings, because a lefty slapper's chart is supposed to cluster at shortstop and third and mixing those dots into her swing chart buries both stories. Infield depth matters more than outfield depth in softball positioning, so many fastpitch coaches chart infield contact on its own page.
Spray Charts by Age
For 9-12 year olds, chart your own hitters only, and treat the chart as a contact map rather than a scouting tool; tendencies are still forming and the useful signal is simply whether a hitter is making consistent contact. From 13-15 (13u, 14u, JV), tendencies are real enough to position off, and charting opponents in tournament pool play starts paying for itself in bracket games. High school varsity and 16u-18u travel programs should chart every game both ways: your hitters' charts drive winter cage plans, and opponent charts are the cheapest scouting a program can run.
From Paper Pad to Automatic Charts
The paper pad's limit is the same as every clipboard tool: the charts live in a binder, one game at a time, and nobody re-draws forty dots into a season picture. Rizzler's hit charting builds the spray chart live as you tap hit type and location during the game, keeps per-player charts across the whole season, and works as a standalone job on iPhone or iPad whether or not anyone is scoring the game; it comes with the paid Coach and Club plans. If you already score games digitally, the scorekeeping apps comparison covers which apps build spray charts from scoring and what each one charges for them.
Frequently Asked Questions
What is a spray chart in baseball?
A field diagram that plots where a hitter's batted balls land, usually coded by hit type and outcome. Read over multiple games, it shows the hitter's directional tendencies and power zones.
Is the printable spray chart free?
Yes. The PDF pad and the Excel hit log both download directly, no email or account.
How many games do you need before a spray chart means anything?
Youth hitters see too few pitches per game for one chart to say much. Treat 25 to 30 balls in play, usually 8 to 12 games, as the floor before letting a chart drive defensive positioning.
What do the letters on a spray chart mean?
The standard code is G ground ball, L line drive, F fly ball, P pop-up, with hits circled and outs slashed. This pad prints the legend on every page; MLB charts you see online use colored dots for the same idea.
Can I see spray charts for MLB players?
Yes, Baseball Savant publishes them for every big leaguer, and they are a good way to learn to read charts. This page and the printable are built for the coach's version of the job: charting your own roster and your opponents.
Want spray charts that draw themselves while you watch the game?
Read Next
Baseball Lineup Template for Excel & Google Sheets (Free)
ResourcesRizzler vs Spreadsheets: Why Coaches Are Switching
ComparisonRizzler vs iScore: Coaching App Comparison
ComparisonHow Much Does Rizzler Cost? Pricing & Plans
FAQPractice Manager: Build a Timed Practice Plan in Minutes
FeaturesThe Libero in Volleyball: Meaning, Rules, and the Jersey
Volleyball