
Volleyball
Volleyball Stats, Explained: What They Mean and Which Ones Matter
Volleyball stats fall into six families, one per skill: attacking (kills, errors, attempts, hitting percentage), serving (aces and errors), serve receive (passing ratings), setting (assists), blocking (solos and assists), and defense (digs). A youth team does not need all of them; it needs the five or six that answer real coaching questions, charted consistently. This hub defines every stat a scorekeeper will ever ask you about, flags the ones worth a youth bench's attention, and shows how to collect them with nothing fancier than a clipboard and our printable stat sheet.
Attacking: Kills, Errors, Attempts, Efficiency
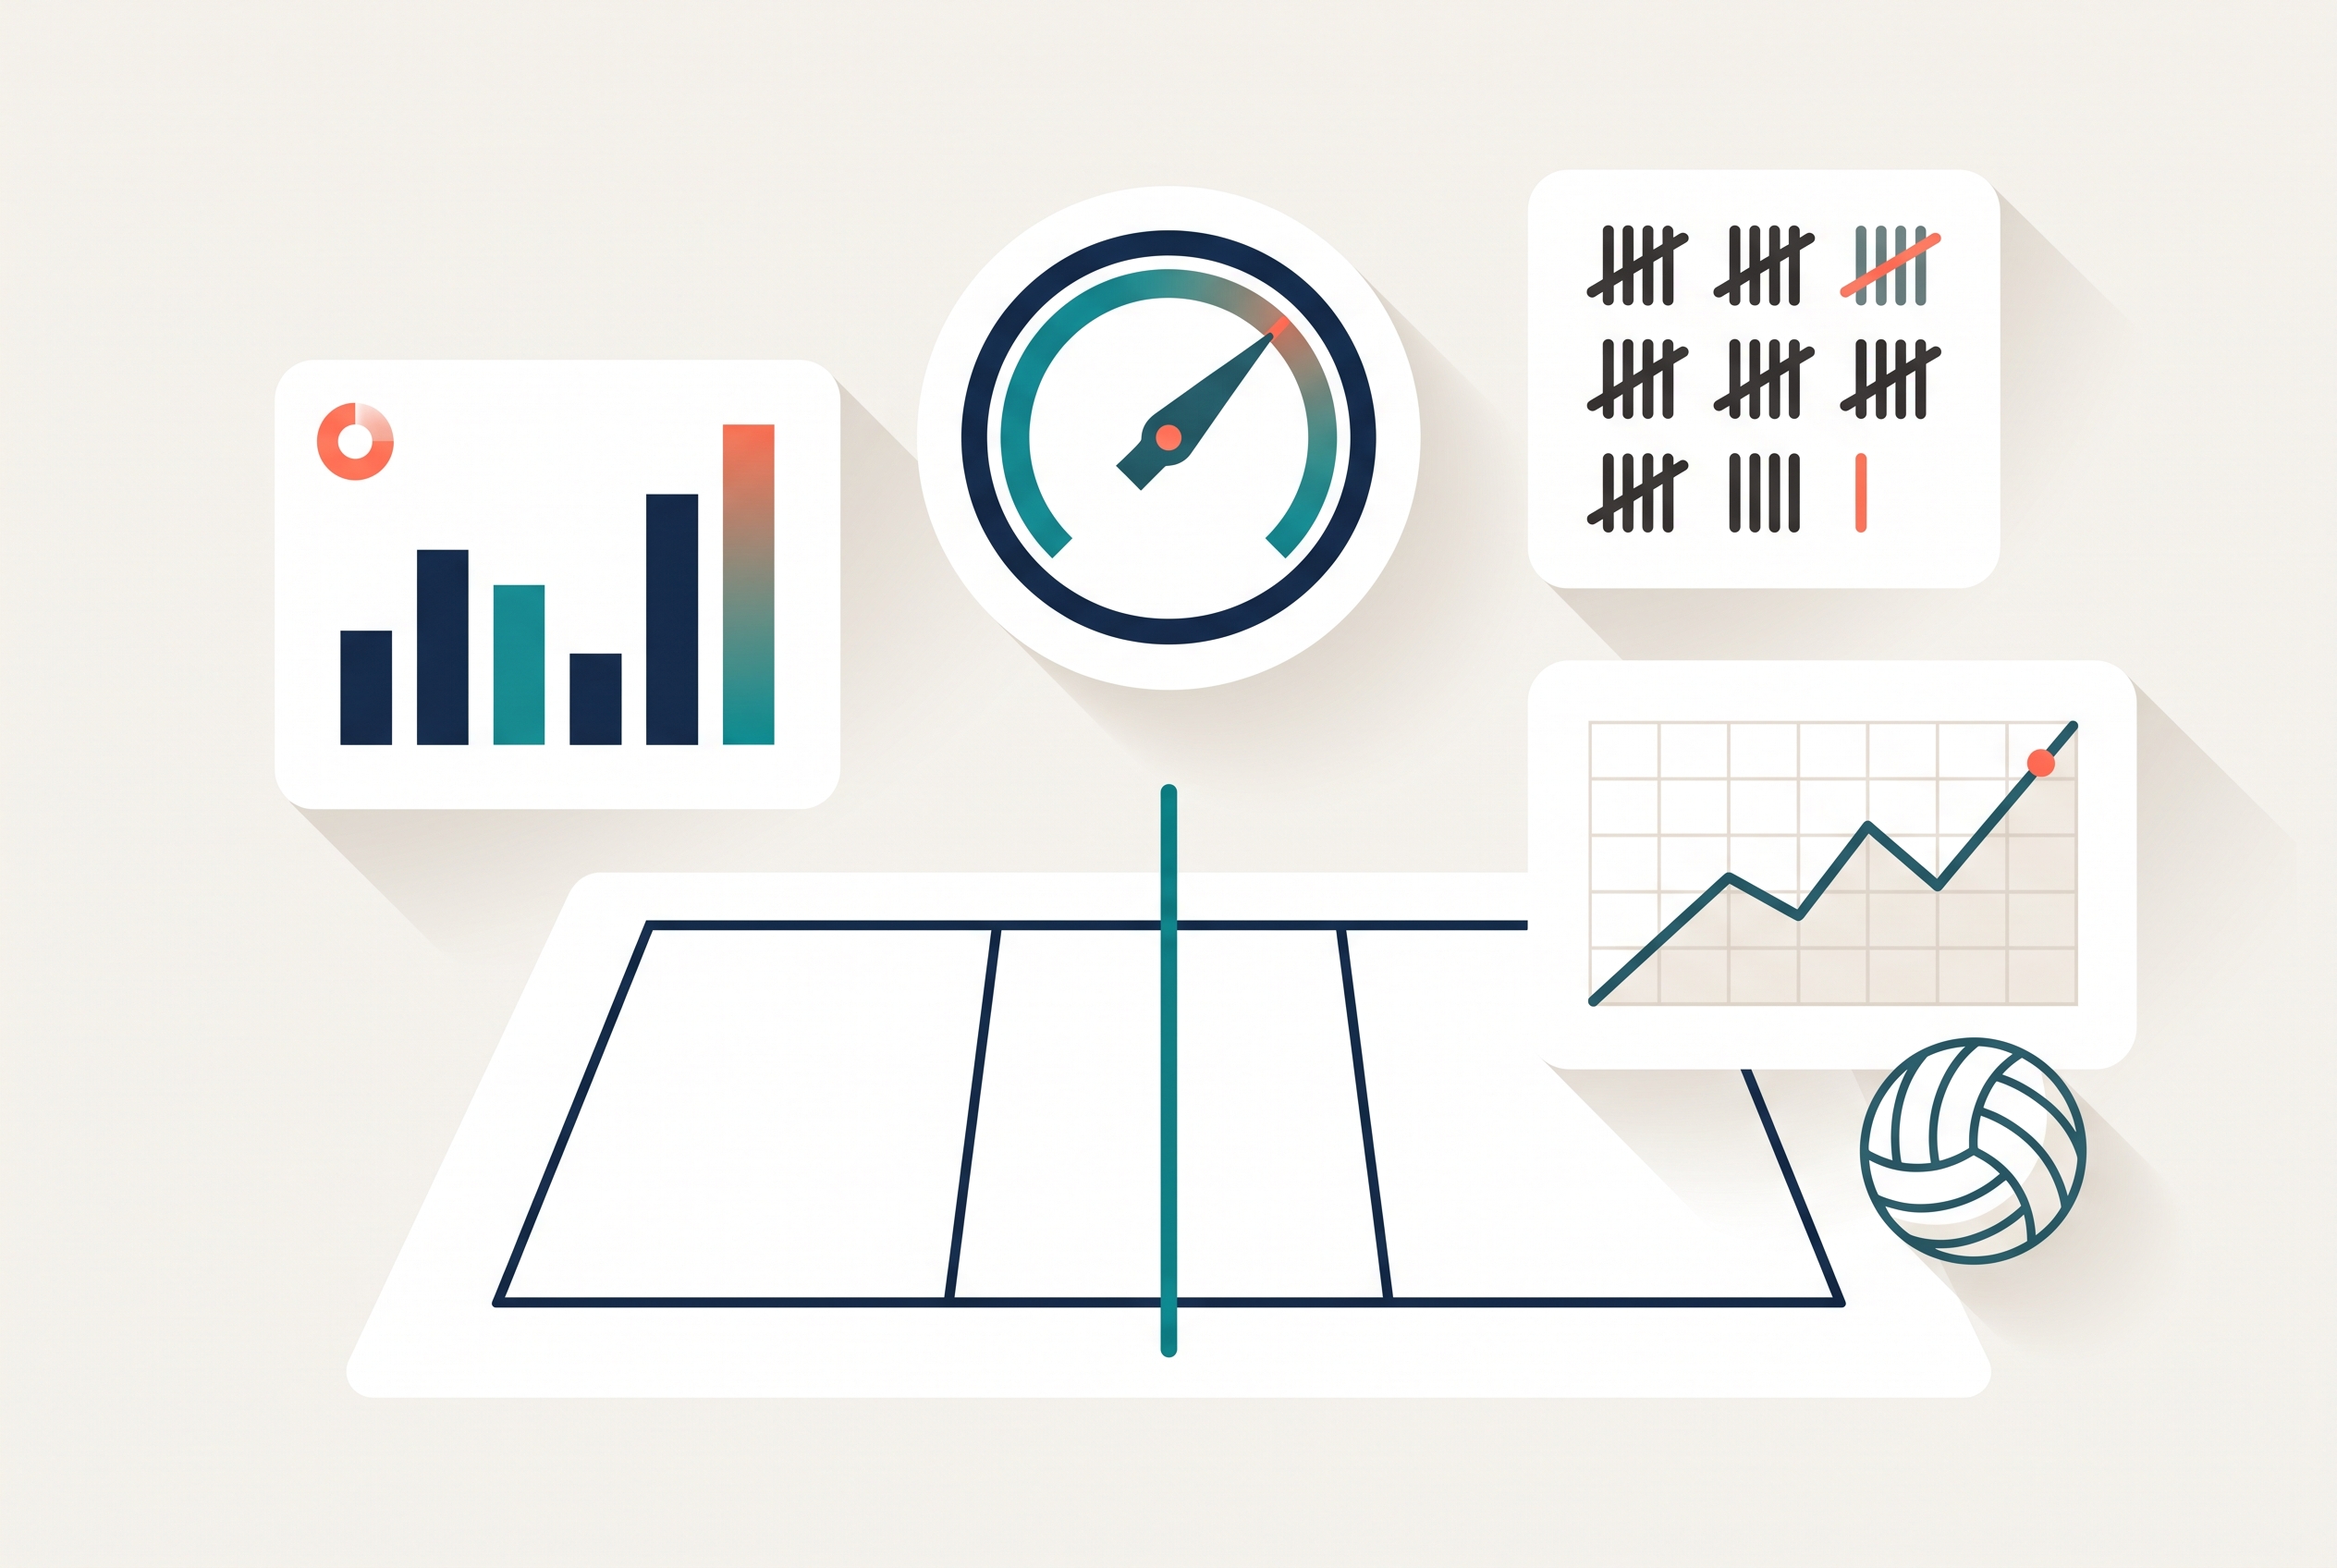
Every attack attempt ends one of three ways: a kill (ends the rally for you), an attack error (ends it for the opponent), or a zero attack (rally continues). Those three counts produce the two attack stats that matter. Kills per set measures production; what exactly counts as a kill, and the edge cases scorekeepers argue about, has its own guide. Hitting percentage, (kills minus errors) divided by attempts, measures efficiency, punishes error-prone swinging, and is the single attack number coaches trust most; that guide includes a calculator and benchmarks by level.
Youth benches should chart all three raw counts (K, E, TA) rather than kills alone. Kills alone reward volume and hide the hitter who donates as many points as she scores.
Serving: Aces, Errors, and the Ratio That Predicts Sets
An ace is a serve that scores directly: it hits the floor untouched, or the receiver's only touch cannot be kept in play. A service error is a serve into the net or out. Between those extremes live most serves, and that is the youth-level insight: at most levels below college, the ace-to-error ratio predicts set wins better than ace count. A server with 2 aces and 5 errors is losing you points; a server with zero aces who lands 19 of 20 with placement is quietly winning the match.
Track makes, misses, and aces per server; the serving drills that build placement all produce these numbers naturally, and your service order should follow the chart.
Serve Receive: The 3-2-1 Passing Rating
Serve receive is graded, not counted: each pass scores 3 (at the target, all offensive options alive), 2 (playable, options limited), 1 (kept off the floor, no options), with an ace against charted as 0. The average is the passing rating. Above 2.2 is strong youth passing; below 1.8 means serve receive is deciding your matches. It is the stat most predictive of youth match outcomes and the one most worth charting per player and per rotation, which is exactly what the receive rounds in our serve receive drills generate.
A reception error (the shanked or untouched serve) is the same event as an opponent ace, recorded from the receiving side.
Setting, Blocking, Defense
Assists. A setter earns an assist when her set leads directly to a kill. Assists track offense flow but flatter or punish the setter for her hitters' finishing, so read them alongside the eye test and the setter's decision work.
Blocks. A solo block scores a point alone; a block assist is shared when two players close the block that scores. Block touches (deflections that slow an attack) rarely make the box score and win more rallies than either; if your bench can chart only one blocking stat, chart touches.
Digs. A dig is a playable defensive save of an attacked ball. The word playable is doing the work: a heroic touch that flies into the bleachers is not a dig. Digs measure back-court range and are the libero's headline number.
What a Youth Team Should Actually Track
Charting everything produces a shoebox of unread numbers. The honest minimum, per set, in priority order:
| Priority | Stat | The question it answers |
|---|---|---|
| 1 | Passing rating (3-2-1) per player | Who should receive serve, and in which rotations? |
| 2 | Serve makes/misses/aces per player | Who serves first, and who needs targets, not power? |
| 3 | K / E / TA per hitter | Who converts, who donates, who needs shot selection work? |
| 4 | Points by rotation | Which rotation leaks points and needs a lineup fix? |
| 5 | Digs, block touches | Who covers court? (Chart when you have a second scorer) |
Points by rotation is the sleeper on the list: tally each rally's winner under the current rotation number and after three matches you know exactly which rotation to fix. The fix itself is usually a serve receive shape or lineup-order change, which is rotation planning territory, and the printable stat sheet has a row built for it.
From Numbers to Development: Closing the Loop
A stat tells you what happened; it cannot tell you why, and it should never be the only thing a young player hears. A falling hitting percentage might be a late approach, poor shot selection, or a passer's bad week. The diagnosis lives one level below the stat, in skills, and that is where Rizzler picks up: the volleyball player evaluation template scores the skills behind each stat family (serving consistency and placement, platform control, setting decisions, attacking shot selection, digging) on a 1-to-5 scale, coaches assign the fixing drills through Rizzler Reps, and a mid-season re-evaluation shows whether the skill moved with the number. Match stats find the symptom; evaluations name the cause; drills treat it.
For match-day planning, the numbers feed the volleyball Game Manager: rotation plans, serve order, and playing-time tracking all improve when the charts above inform them. Stat collection itself stays wonderfully low-tech; the clipboard has not been beaten at the youth level.
Frequently Asked Questions
What are the main stats in volleyball?
Kills, attack errors, and attempts (combined into hitting percentage) for attacking; aces and errors for serving; the 3-2-1 passing rating for serve receive; assists for setting; solo blocks, assists, and touches for blocking; digs for defense.
What is the most important stat in volleyball?
At the youth level, the serve receive passing rating: it predicts match outcomes better than any attacking number because everything an offense does starts with first contact. At higher levels, team hitting percentage takes over as the strongest predictor.
What is a good hitting percentage in volleyball?
Roughly .150 for middle school, .200 for JV, .230 for varsity, and .270 for NCAA women's play, with middles running higher than outsides. The full benchmarks, the formula, and a calculator are in our hitting percentage guide.
How do you keep stats for a volleyball team?
A clipboard chart with per-player tally columns covers the top four priorities: passing ratings, serve results, K/E/TA, and points by rotation. Tally between rallies, total at set breaks. Our printable volleyball stat sheet is laid out exactly this way.
What is the difference between a dig and a pass?
Both are first contacts, graded by what they enable, but a pass receives a serve while a dig saves an attacked ball. Serve receive is charted 3-2-1; digs are counted, and only playable saves count.
What does a stat sheet track in volleyball?
Per player, per set: passing rating, serve makes, misses and aces, kills, errors and attempts, plus team points by rotation. Blocking and digs join when a second scorer is available. That is the exact layout of our printable stat sheet template.
Talk to our team
Want to spend more time coaching and less time with paperwork? Let's talk.
Tell us about your team and we'll show you how to plan games, set lineups, run the schedule, and develop players in one place, so you spend the season coaching instead of chasing admin.
Less admin, more coaching
Plan games, set lineups, and track the season in one place
Keep every family in the loop automatically
Tell us about your program
4 fields · takes 30 seconds
Lands in the same inbox as the Help button · human response only
Read Next
How to Build a Batting Order for 13U-14U Baseball
LearnRizzler Reps for Basketball: Assigned Drills, Streaks, and At-Home Training
BasketballYouth Basketball Practice Plan: 60-Minute Sessions for Grades K-6
BasketballSoftball Practice Plans: 8U, 12U, 14U, and High School Sessions
LearnVolleyball Practice Plans: Ready-to-Run Sessions by Focus
VolleyballTournament Planning for Youth Baseball: Plan Your Whole Weekend
Features